Equations for Uniform Acceleration
Summary
⇒ Velocity-time graphs can be used to derive various different formulas
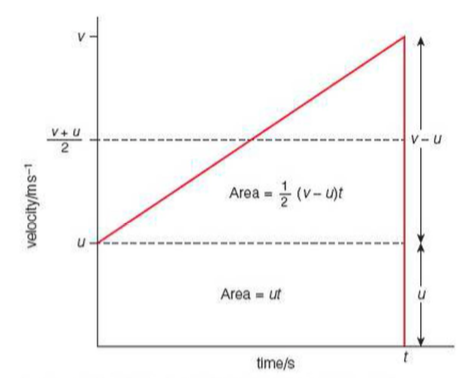
⇒ This velocity-time graph shows a vehicle increasing its velocity with a consent acceleration, a, from an initial velocity, u, to a final velocity, v, over a time, t
The first equation
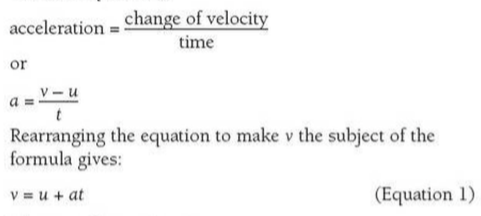
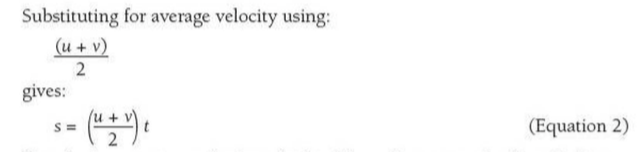
The second equation
⇒ Displacement = average velocity x time
⇒ The average velocity is half way between the initial and final velocities
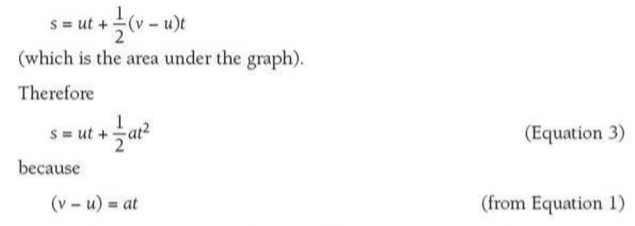
The third equation
⇒ The displacement can also be calculated from the area under the velocity-time graph
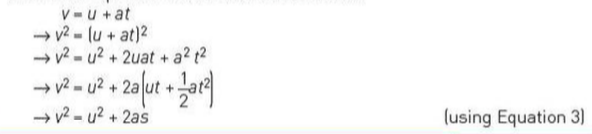
The fourth equation
⇒ This links velocity, acceleration and displacement...

⇒ There is no need to be able to derive these equations as they will be given in the exam. However, the derivation of the fourth equation is provided below:
Example
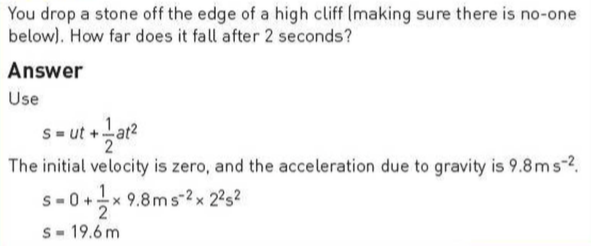
Example 1
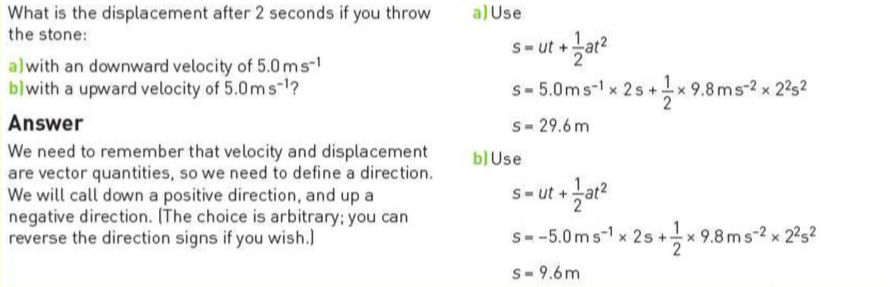
Example 2
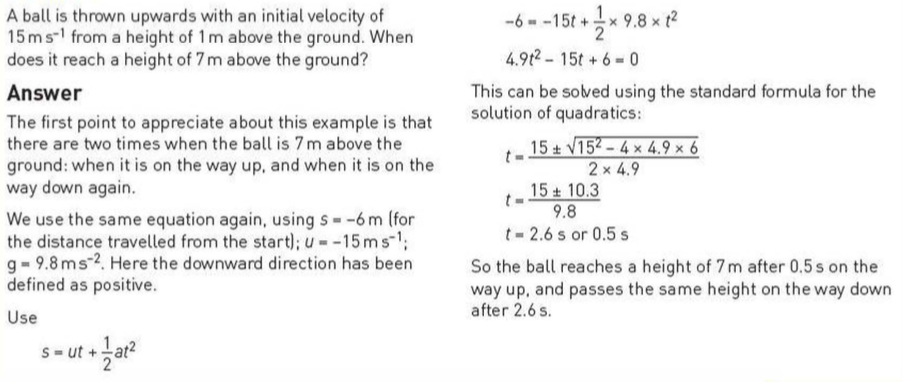
Example 3
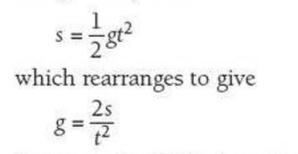
Acceleration due to gravity, g
⇒ Galileo Galilei demonstrated that gravity accelerates all masses at the same rate, provided air resistance is very small
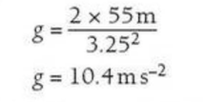
⇒ Knowing this, you could calculate the acceleration due to gravity using the following:
⇒ For example, you could imagine Galileo dropping a ball from the Leaning Tower of Pisa (55m high) and taking 3.25s to fall:
Terminal Speed
⇒ Terminal speed is the speed reached when the weight of an object in free fall is balanced by the drag forces (e.g. wind resistance) acting upwards
⇒ Drag is the name given to resistive forces experienced by an object moving through a fluid such as air or water
⇒ The size of the drag on a falling object increases with:
- Speed
- Surface area
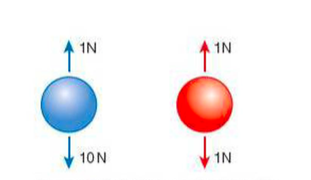
⇒ This image shows how drag affects two similar balls - they are the same size/shape, but the blue ball weighs 10N and the red ball weighs 1N
⇒ Both balls fall at the same speed and both have an upward drag of 1N, but the blue ball continues to accelerate as it has a resultant downward force whereas the red ball moves at a constant speed because the force of gravity is balanced by the drag
- In other words, the red ball has reached its terminal speed
Extra
⇒ Also see our notes on: