Motion in a Straight Line
What you should know
⇒ Average speed = distance ÷ time
⇒ Average veloicty = displacement ÷ time
⇒ Acceleration is a vector as it has a direction:
- Acceleration = change of velocity ÷ time
⇒ The gravitational field strength (g) near a planet is defined as the gravitational force acting on each kilogram
- On Earth, g = 9.81 Nkg-1
⇒ Newton's first law of motion: an object will continue to move in a straight line with a constant speed (or remain at rest) unless acted on by an unbalanced force
⇒ Newton's second law of motion: resultant force = mass x acceleration
Displacement-Time Graphs
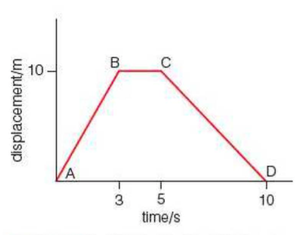
⇒ This shows a displacement-time graph (s-t) for a walker
⇒ In the first three seconds he walks to the right (this is shown to be positive); then he stands still for two seconds (displacement does not change); then he moves back left for 5 seconds to where he started
- So after 10 seconds, displacement is zero
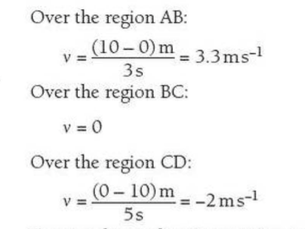
⇒ Because the gradient is negative between C and D the velocity is negative i.e. the walker is moving left
⇒ In the displacement-time graph above, there are three constant velocities - as a result, the gradients are constant, so a straight-line graph is produced
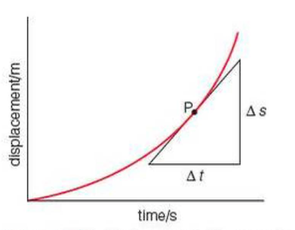
⇒ This shows a displacement-time graph for an accelerating vehicle - as velocity increases, the gradient increases
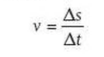
⇒ To calculate velocity at point P, we measure the gradient - to do this, draw a tangent to the curve at that point (P), then measure a small change in displacement over a small time interval:
Velocity-time Graphs
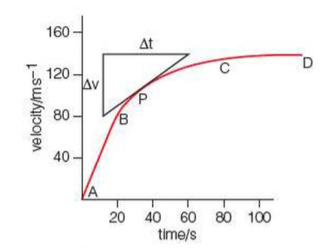
⇒ This shows a velocity-time graph for a plane as it takes off
⇒ It begins by accelerating at a constant rate (A to B) and then the acceleration slows until the plane reaches a constant velocity at point D
⇒ Between A to D the graph shows that the acceleration is 4 ms-2
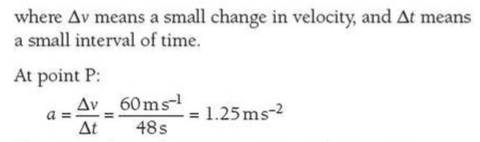
⇒ But over the region B to C, the gradient changes, so we now use the formula:

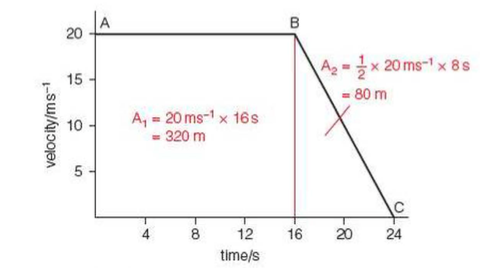
⇒ This graphs shows how to use a velocity-time graph to calculate the distance travelled by a motorbike
⇒ Between A and B the motorbike travels at a constant velocity before decelerating between B and C
⇒ While the velocity is constant, the distance travelled is represented by area A1, which is 320m
⇒ While the bike deceleates, we could use the formula: distance = average velocity x time
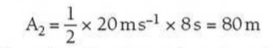
⇒ Or we could simply calculate the area again, by using the formula for calculating the area of a triangle:
Extra
⇒ Also see our notes on: