Stress and strain: the Young modulus
Introduction
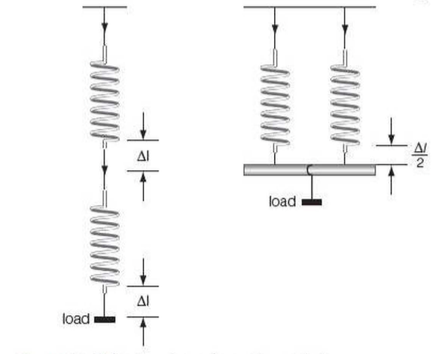
⇒ As we mentioned in our notes on Hooke's Law, when two identical springs are joined in series, we saw that the spring extended twice as much as a single spring on its own
- The extension depends on its original length
⇒ Similarly, if we join two spring in parallel, then the springs extend half as much as a single spring on its own
- The extension depends on the area over which the force is acting
⇒ In each case, the property of the object depends on the dimensions of the object itself
⇒ If we want to compare materials fairly, rather than compare two different objects, then it is better to have a measurement that doesn't depend on the shape or size of the object
- The comparison is made by using stress or strain instead of force and extension
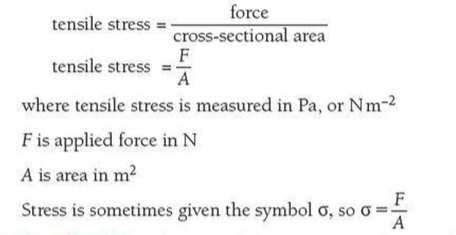
Tensile stress
⇒ Tensile stress is a measurement of the force applied over the cross-sectional area of sample of material
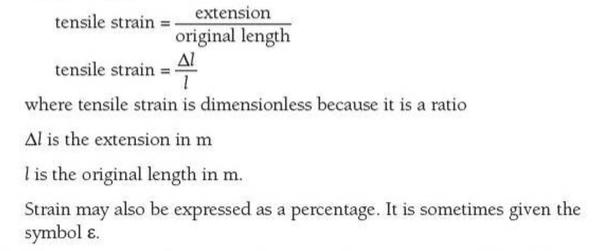
Tensile strain
⇒ Tensile strain is the ratio of the extension and original length of the sample
The Young Modulus
⇒ We can now use these quantities to calculate a measure of the stiffness of an elastic material that is independent of the shape of the sample of the material
⇒ This is called the Young Modulus, E, of the material
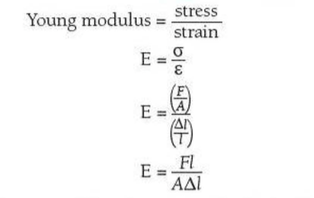
⇒ Young modulus is measured in Pa (or Nm-2)
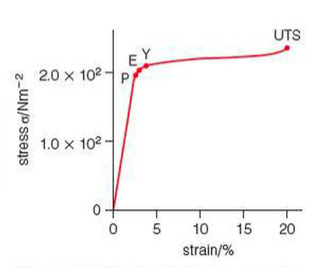
⇒ This graph shows a stress-strain graph for copper
- It looks like the force-extension graph shown earlier, but this graph will be valid for ANY sample of copper
⇒ O-P on the graph represents the range of tensile stree for which the copper obeys Hooke's law
- The gradient of this section is the Young modulus for copper
- This value will be the same no matter what the size or shape of the sample of copper being used
- Point P represents the limit of proportionality for the material
⇒ Point E on the graph represents the elastic limit
- Up to point E, if the stress is removed, the sample of copper will return to its original length
- Beyond this point, copper behaves plastically; it does not return to its original length
⇒ The yield point of the material is given by Y
- This is the value of stress beyond which the strain increases rapidly for small increases in stress
⇒ The ultimate tensile stress (UTS) of copper is sometimes called the 'maximum strength' or 'strength of the wire'
- Just before this point the copper becomes narrower at the weakest point, known as necking
- The UTS is the stress at which the material breaks
⇒ Some materials will also show a phenomemon known as creep
- This is when the sample continues to extend over a period of time, even though the stress applied is not increased
Example
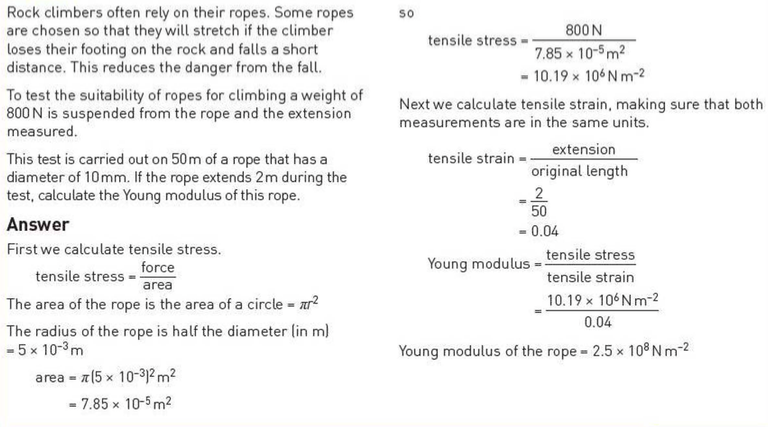
Experiment
⇒ A simple experimental set-up for copper can be used to measure its Young modulus
⇒ But, if you want to be accurate, you can use an experimental set-up like this:
- This is particularly useful for materials such as steel, which generally give smaller values of strain
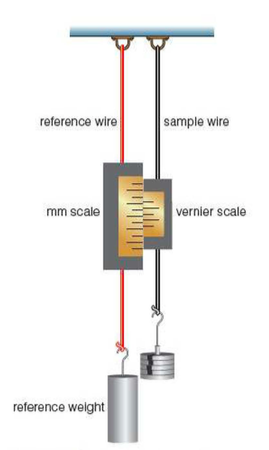
⇒ Here, the left-hand wire is a reference wire that holds the main scale of the vernier calipers, usually calibrated in milimeters
⇒ The reference wire has a mass hung from it to keep it taut
⇒ The sample wire (made from the same material) is hung close to the reference wire and holds the smaller scale of the vernier calipers
⇒ As weights are added to the sample wire it extends, and the scale moves relative to the main scale - this allows the extension of the wire to be measured
Interpreting stress-strain graphs
⇒ Stress-strain graphs allow us to describe the properties of materials, and also to predict the stresses at which changes in these properties might occur
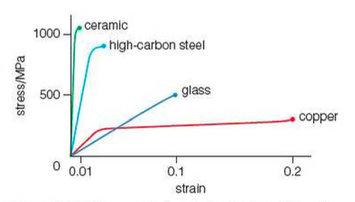
⇒ This graph compares the stress-strain graphs for four different materials: ceramic, steel, glass and copper
- Ceramics are extremely strong and have very high UTS values. However, they show very little plastic behaviour before they fracture, so they are also very brittle
- Glasses have lower UTS values than ceramics and so are less strong, but they are also brittle, generally showing no plastic behaviour before they break
⇒ Steel is made by adding different elements to iron to form an alloy
- Common elements used in steel-making are carbon, manganese, and chromium
- Types of steel differ in the percentage composition of the various elements added to iron to create them
- This affects the properties of the steels and they are generally much stiffer than ductile metals such as copper
- This can be seen on the graph from the shallower gradient of copper giving a lower value of Young modulus
⇒ The high-carbon steel shown in the graph is a strong but brittle material
- It shows elastic behaviour at higher values of stress but fractures with little plastic behaviour
- This type of steel is often used in cutting tools and drill bits because it has a higher UTS value
- Other types of steel may show plastic behaviour but have a lower UTS value
⇒ Copper has a plastic region because it is a ductile material, and this makes it ideal for forming into wires for use in electrical circuits
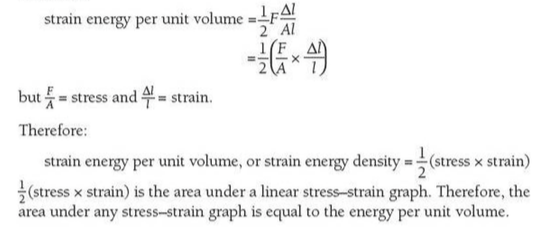
Strain energy density
⇒ The strain energy density is the strain energy per unit volume of a sample
- Again, this does not depend on the dimensions of the material being tested (the result will be the same for all materials, regardless)
⇒ From earlier we saw that: Strain energy = 1/2 F▵l
⇒ If l is the original length of the wire, and A is its cross section, then the volume of the wire is Al. Therefore:
Example
Extra
⇒ Also see our notes on: